Not
many casual users know about the Activity Monitor, fewer still
understand what it can really do apart from force-quitting an
application. In this overview of the Activity Monitor, we dissect the
user interface, learn to manage memory, kill unresponsive applications
and dissect active processes.
Note: we will be looking at Activity Monitor 10.8.0. (the default Mountain Lion version) in this article. While most of the discussed functionality should remain the same in newer versions, it might not exist or might have different nomenclature in older versions.
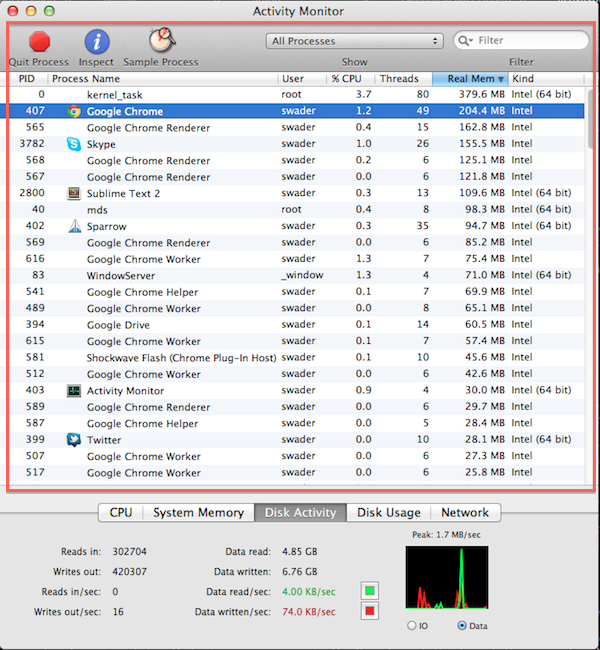
The main process list
The main table lists all your running processes (programs and
daemons) and their information. The default columns are PID (process
ID), process name, the user who started the process, the CPU % the
process is using at any given time (anything consistently above 10%
should be scrutinized), threads (wiki), real mem (the memory usage of the process) and kind (indicating whether it’s a 32bit or 64bit process).

The memory tab

The stats tab

The open files and ports tab
This part isn’t especially important, unless you're nitpicking - the
thing with OS X performance is that it’s usually fairly evident what’s
causing the delays and hangs from the main screen without going into too
much detail. However, it's good practice just going through the offered
tabs:
So if an application is hanging frequently without using up all CPU or RAM, some hints might be dropped by sampling it while being frozen, like in this example.
While doing this, it is important to remember to select All Processes from the drop down selector above the main table, because it will also include processes not currently owned by the logged in user (for example, the _windowserver user starts and owns the WindowServer process).
Abort, Quit and Kill usually have the same consequence as the main Quit Process button, but Interrupt and Hangup can sometimes wake up the application without killing it.

The send signal menu

The CPU Tab
The CPU tab gives us three percentage indicators: User, System and
Idle. Even though they're fairly self-explanatory, let’s walk through
them anyway.
User is the total percentage of CPU used by all the user-initiated and user-owned processes currently active. System is the same thing, only not pertaining to User, but to everything else. Idle is the leftover - 100% minus those two counts above it. When not using the machine or while doing some light browsing, your Idle % should never be under 90%.
Further to the right Activity Monitor presents us with some graphs - the look of these graphs depends on the number of cores and threads in your CPU. For example, my Macbook Pro 8.1 has an Intel i5 2.3Ghz dual-core CPU. However, this CPU has multi threading, meaning it has two threads on every core (two simultaneous threads can be run on a single core - much like a quad-core CPU) and effectively, this counts as 4 cores. Thus, four graphs (see screenshot above).
If you wish to have your CPU usage stats in a more accessible position you can select View -> Dock Icon -> Show CPU Usage to have it in the dock instead of the Activity Monitor’s default icon when it’s running. Alternatively, you can select Window -> CPU Usage to have it on screen as a popup. Optionally, select Window -> Keep CPU Window on top to keep the popup visible at all times. This is very practical when using two or more monitors.

System Memory
While OS X has quite an efficient memory management system, sometimes
it just isn’t enough. When dealing with non-natively supported virtual
machines and languages or technologies which were intentionally made
worse by Apple in order to kill them off on OS X, you might notice
extreme resource consumption in both CPU and RAM.
For example, when using Java or Flash, memory management becomes measurably worse and will sometimes stay "clogged" for hours after you’re done using the specific application - the OS simply fails to release it.
There are four types of memory on an OSX system:
Then there’s page-ins, which indicate how much and how fast data is being copied into the RAM from the hard drive, and page-outs which indicate how much data is being copied from RAM to the hard disk. According to Apple, if page-outs speed is above zero during normal workload, the Mac could benefit from some extra RAM.
Just like with CPU data, RAM data can be made persistently visible as well. To do this, you need to go to View -> Dock Icon -> Show Memory Usage. This option will turn Activity Monitor’s icon in the dock into the RAM usage pie chart from the tab we just looked at. Colors can also be changed by clicking the color squares next to the values.

Disk Activity
Disk Activity breaks down information on current disk usage, number
or total reads and writes and speed of reads and writes. Just like CPU
and Memory, Disk Activity can have its colors changes as well, and can
be displayed as a Dock Icon via View -> Dock Icon -> Disk Activity.

Disk Usage
Disk usage is fairly straightforward - it measures the amount of hard
drive space that's currently in use (including the aforementioned swap
file) and the part of the hard drive that's available.
While Disk Usage cannot be represented as a Dock Icon, you can change its colors just like in the previously described tabs. Disk Usage will list all your available storage devices in the drop down menu - including external devices like USBs or external hard drives.

Network
The Network tab will display information on network traffic -
regardless of whether it's wired or wireless. If you try downloading a
file, you should see it spike significantly.
This tab will serve little purpose when not watching your bandwidth and even then, there's more precise dedicated network sniffing applications out there you could use if you wanted to dissect your network traffic to a greater extent. For example, Little Snitch can analyze traffic per-application and even act as a firewall alternative to the native mac Firewall.
Learn to use it often and refer to it whenever you feel your computer has a cough coming on and, in time, you'll be able to diagnose and fix most issues on your Mac like a pro. Once you get familiar enough with it, I guarantee you won't work another day without having at least one look at it while performing your daily tasks.
If you find any other features of Activity Monitor invaluable or have more methods of bringing stalled applications back to life, please post them in the comments, we're eager to hear them!
Note: we will be looking at Activity Monitor 10.8.0. (the default Mountain Lion version) in this article. While most of the discussed functionality should remain the same in newer versions, it might not exist or might have different nomenclature in older versions.
What is Activity Monitor?
The Activity Monitor is OS X’s native GUI application for taking your computer’s pulse. It shows you the processes that are running, the memory being used, who the biggest resource hogs are and allows you kill off the processes that are being too selfish with your computer’s resources. It also helps you see network traffic, disk write/read operations and other useful diagnostic data. It is Apple’s version of the Task Manager in Windows.The Activity Monitor is OS X’s native GUI application for taking your computer’s pulse.Please open the Activity Monitor now by going to Applications -> Utilities -> Activity Monitor, or by just searching for Activity Monitor in Spotlight. Let us first have a look at the main part of the screen - the data table of processes.
The Main Screen
The main process list
Process Details
To see more data columns, right click the column headers and select those you want to see or hide. Double clicking a process or selecting it and clicking Inspect will open more details about it.The memory tab
The stats tab
The open files and ports tab
- Memory: The amount of each type of memory the process is using
- Statistics: Other stats like how long it's been alive, how many threads are active at the moment, etc.
- Open Files and Ports: The files and ports in use by the application / process. Please note that an open file will not be listed here (i.e. you open an image in Preview) - this only lists the files and ports the process is using in order to work
So if an application is hanging frequently without using up all CPU or RAM, some hints might be dropped by sampling it while being frozen, like in this example.
Handling Problematic Applications
When you notice an application is hanging (it takes too long to respond and/or you get the spinning beach ball cursor), you have several choices:- You can wait for it to become responsive again. This rarely works if it hasn't become responsive after 10 seconds of waiting.
- You can try focusing it (so that its name appears in the Menu bar at the top of the screen) and hitting CMD+Q. Sometimes this wakes up the application, but also shuts it down in the process.
- You can select Force Quit by right clicking the application in the Dock. This is identical to CMD+Q, only it forces an application to close. The application cannot refuse.
- You can summon the Force Quit Applications menu by hitting CMD+Option+ESC and selecting it there. This is identical to Right-clicking and Force Quitting.
- You can open Activity Monitor, which in itself sometimes helps the stuck application wake up.
- Finally, you can use Activity Monitor to find the culprit and force close it.
Finding the Problem
The main screen described in the previous section is essentially there for you to locate these troublesome processes and end them if necessary. All you usually need to do to find the problematic process is look for the red "Application not responding" suffix on a process' name.If one process stands out as consistently having over 10% CPU usage or over 1GB of active RAM, it is likely problematic.If that isn't present, try sorting by CPU or Real Mem usage, and see which ones come out on top. If one process stands out as consistently having over 10% CPU usage or over 1GB of active RAM, it is likely problematic.
While doing this, it is important to remember to select All Processes from the drop down selector above the main table, because it will also include processes not currently owned by the logged in user (for example, the _windowserver user starts and owns the WindowServer process).
Handling the Problem
At this point, you can either select the problematic process and hit Quit Process to shut it down by force, or you can send the process a signal from within Activity Monitor. Go to View -> Send Signal To Process, and select either Interrupt, Hangup, Quit, Abort or Kill.Abort, Quit and Kill usually have the same consequence as the main Quit Process button, but Interrupt and Hangup can sometimes wake up the application without killing it.
The send signal menu
CPU
Let’s turn our attention to the bottom part of the window now and look at the CPU tab.The CPU Tab
User is the total percentage of CPU used by all the user-initiated and user-owned processes currently active. System is the same thing, only not pertaining to User, but to everything else. Idle is the leftover - 100% minus those two counts above it. When not using the machine or while doing some light browsing, your Idle % should never be under 90%.
When not using the machine or while doing some light browsing, your Idle % should never be under 90%.
Threads and Processes
To the right, you can see two more numbers: Threads and Processes. Threads signifies the total number of living threads from all processes currently active. Processes is simply the total number of living processes on the current machine.Further to the right Activity Monitor presents us with some graphs - the look of these graphs depends on the number of cores and threads in your CPU. For example, my Macbook Pro 8.1 has an Intel i5 2.3Ghz dual-core CPU. However, this CPU has multi threading, meaning it has two threads on every core (two simultaneous threads can be run on a single core - much like a quad-core CPU) and effectively, this counts as 4 cores. Thus, four graphs (see screenshot above).
The numbers you see in this area directly correspond to values in the main area.The numbers you see in this area directly correspond to values in the main area - the sum of all CPU expenses in the main table equates to User + System in the CPU tab. You can also change the color that represents each percentage, in case you don’t like them or have trouble discerning colors. Simply clicking one of the squares next to a percentage output will summon a color picker, which you can then use to alter the color signature of a CPU load type.
If you wish to have your CPU usage stats in a more accessible position you can select View -> Dock Icon -> Show CPU Usage to have it in the dock instead of the Activity Monitor’s default icon when it’s running. Alternatively, you can select Window -> CPU Usage to have it on screen as a popup. Optionally, select Window -> Keep CPU Window on top to keep the popup visible at all times. This is very practical when using two or more monitors.
System Memory
System Memory
For example, when using Java or Flash, memory management becomes measurably worse and will sometimes stay "clogged" for hours after you’re done using the specific application - the OS simply fails to release it.
There are four types of memory on an OSX system:
- Free: The RAM that isn’t being used.
- Wired: The RAM that is currently being used and is locked - meaning the data it holds cannot currently be moved to the hard drive. It pertains more to system processes than user processes.
- Active: Information in RAM that has recently been used or is in use by applications.
- Inactive: Information in RAM that has been recently used, but less recently than Active. Like Apple’s website says, if you close an application, its Active RAM is converted to Inactive and is available to other apps as Free RAM. But if you open the application you closed, it will start up much sooner because it will get its RAM by converting from Inactive that it just "owned", instead of the slower "Free" pool.
Purging Memory
While OS X periodically does purge Inactive memory and converts it into Free, sometimes it takes too long or just forgets about it, effectively crippling some applications that require large amounts of memory like Virtual Machines. To perform a manual purge, all you need to do is open the terminal and type purge. Note that you need Developer Tools installed for this - a free (albeit quite large download) via the App Store.VM Size, Page-ins, Page-outs & Swap Used
To the right of these stats, we can see VM size, which indicates the amount of reserved virtual memory apps have requested. Applications can request a certain amount of VM if they expect to need it, but the actual amount of VM in use is usually much smaller.Then there’s page-ins, which indicate how much and how fast data is being copied into the RAM from the hard drive, and page-outs which indicate how much data is being copied from RAM to the hard disk. According to Apple, if page-outs speed is above zero during normal workload, the Mac could benefit from some extra RAM.
If page-outs speed is above zero during normal workload, the Mac could benefit from some extra RAMFinally, we have "swap used," which tells us the amount of hard disk space currently being used as Virtual Memory. The swapfile is a data file containing the RAM information that didn’t fit into RAM and wasn’t requested as recently as some other data. You can find the swap files in /private/var/vm, but it’s recommended not to touch them.
Just like with CPU data, RAM data can be made persistently visible as well. To do this, you need to go to View -> Dock Icon -> Show Memory Usage. This option will turn Activity Monitor’s icon in the dock into the RAM usage pie chart from the tab we just looked at. Colors can also be changed by clicking the color squares next to the values.
Disk Activity
Disk Activity
Disk Usage
Disk Usage
While Disk Usage cannot be represented as a Dock Icon, you can change its colors just like in the previously described tabs. Disk Usage will list all your available storage devices in the drop down menu - including external devices like USBs or external hard drives.
Network
Network
This tab will serve little purpose when not watching your bandwidth and even then, there's more precise dedicated network sniffing applications out there you could use if you wanted to dissect your network traffic to a greater extent. For example, Little Snitch can analyze traffic per-application and even act as a firewall alternative to the native mac Firewall.
Conclusion
Activity Monitor is one of OSX's hidden gems. It not only allows you to kill unresponsive applications and processes, it also helps you gain insight into many hidden but invaluable facets of your computer - from CPU and RAM usage to Network busyness.Learn to use it often and refer to it whenever you feel your computer has a cough coming on and, in time, you'll be able to diagnose and fix most issues on your Mac like a pro. Once you get familiar enough with it, I guarantee you won't work another day without having at least one look at it while performing your daily tasks.
If you find any other features of Activity Monitor invaluable or have more methods of bringing stalled applications back to life, please post them in the comments, we're eager to hear them!

.webp)


