The Plan
In this tutorial we'll walk through the process of creating a branded Google map for an imaginary client. Our map will include three key features:- Custom markers at each of the client's branch locations
- The client's logo in a fixed position on the map
- Map theming which compliments the client's branding

Creating the Base Map
We'll get the ball rolling by creating a basic map centered on the city of Melbourne. After we add our branch markers we'll refine the center position of the map, but for now we'll start by finding the right latitude and longitude in order to show the city as a whole.Initial Latitude and Longitude
To do this go to Google Maps and search for Melbourne, then zoom in just a little so you're not including unpopulated areas. As you adjust the position of the map you'll notice the URL changes to reflect your new latitude, longitude and zoom level. When you have the map positioned where you like, copy the URL somewhere for later reference, e.g:https://www.google.com/maps/place/Melbourne+VIC/@-37.804627...
After the
@ symbol in the URL you'll see comma separated values for the latitude, longitude and zoom level: -37.8046274,144.972156,12zThe first value
-37.8046274 is the latitude, the second value 144.972156 is the longitude, and the 12z value means the zoom level is set to 12. We're now going to plug these values into a basic map.Basic Markup
Create a blank HTML document and add the following code:
01
02
03
04
05
06
07
08
09
10
11
12
13
14
15
16
17
18
19
20
21
22
23
24
25
26
27
28
29
30
31
32
| <!DOCTYPE html><html> <head> <meta name="viewport" content="initial-scale=1.0, user-scalable=no" /> <style type="text/css"> html { height: 100% } body { height: 100%; margin: 0; padding: 0 } .wrap { max-width: 75em; min-height: 40em; height:100%; width:100%; margin: 0 auto; padding-top: 2.5%;} #map-canvas { height: 90%; } </style> </script> <script type="text/javascript"> var map; var centerPos = new google.maps.LatLng(-37.8046274,144.972156); var zoomLevel = 12; function initialize() { var mapOptions = { center: centerPos, zoom: zoomLevel }; map = new google.maps.Map( document.getElementById("map-canvas"), mapOptions ); } google.maps.event.addDomListener(window, 'load', initialize); </script> </head> <body> <div class="wrap"> <div id="map-canvas"></div> </div> </body></html> |
div with the id map-canvas which will hold our map. We've also added some basic CSS to size and position the map-canvas div.Lastly, we've loaded the required script from the Google Map API with:
1
|
01
02
03
04
05
06
07
08
09
10
11
12
13
| <script type="text/javascript"> var map; var centerPos = new google.maps.LatLng(-37.8046274,144.972156); var zoomLevel = 12; function initialize() { var mapOptions = { center: centerPos, zoom: zoomLevel }; map = new google.maps.Map( document.getElementById("map-canvas"), mapOptions ); } google.maps.event.addDomListener(window, 'load', initialize);</script> |
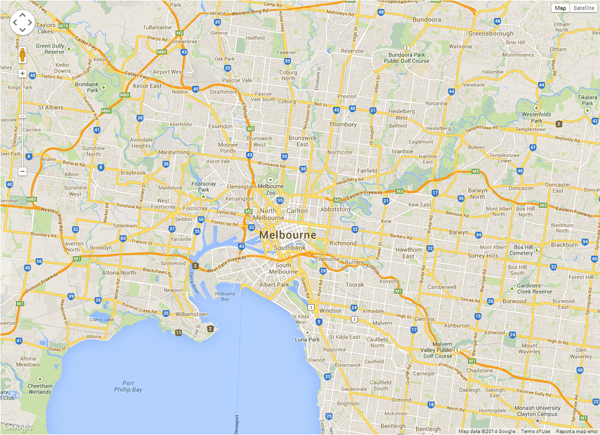
centerPos and zoomLevel variables, which are in turn used in the mapOptions array. The centerPos variable uses the comma separated latitude and longitude values of -37.8046274,144.972156, and the zoomLevel variable uses the value of 12.Save your HTML file and open it up in any browser. Your base map should look a bit like this:
Adding Branch Location Markers
The next step is to find the latitude and longitude for each of the client's branch locations, so we can create markers for them at those positions. The easiest way to do this is to find each branch address via a Google Maps search and grab the latitude and longitude from there.Find Latitude and Longitude of Each Branch
Head back to Google Maps again and run a search for each branch location. Assuming the client has given you the addresses of each location, you can simply search for that address and a marker will appear on the map. Right click that marker and choose What's here? from the context menu.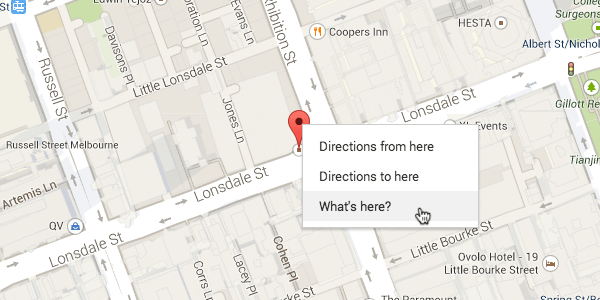
Add Locations to the Initialize Function
Make a note of the latitude and longitude for each of the branch locations you want to add to your map. In the case of "The Hobby Shoppe" we have seven branch locations and we'll add markers for each by inserting the following code just before the end of our map'sinitialize() function, after the map = new google.maps.Map... line:
01
02
03
04
05
06
07
08
09
10
11
12
13
14
15
16
17
| var locations = [ ['First Shoppe', -37.808204, 144.855579], ['Second Shoppe', -37.675648, 145.026125], ['Third Shoppe', -37.816935, 144.966877], ['Fourth Shoppe', -37.818714, 145.036494], ['Fifth Shoppe', -37.793834, 144.987018], ['Sixth Shoppe', -37.737116, 144.998581], ['Seventh Shoppe', -37.765528, 144.922624]];for (i = 0; i < locations.length; i++) { marker = new google.maps.Marker({ position: new google.maps.LatLng(locations[i][1], locations[i][2]), title: locations[i][0], map: map });} |
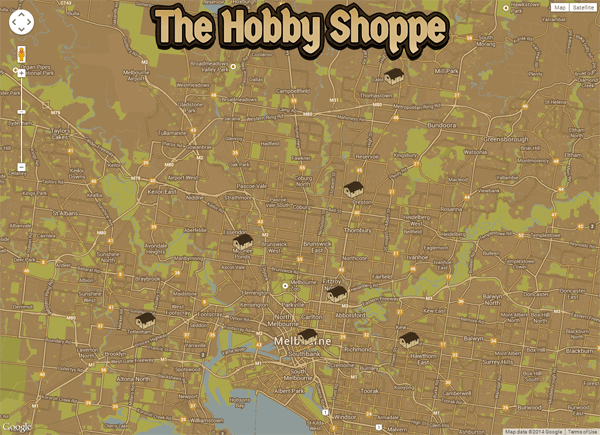
Your map should now have markers added like so:
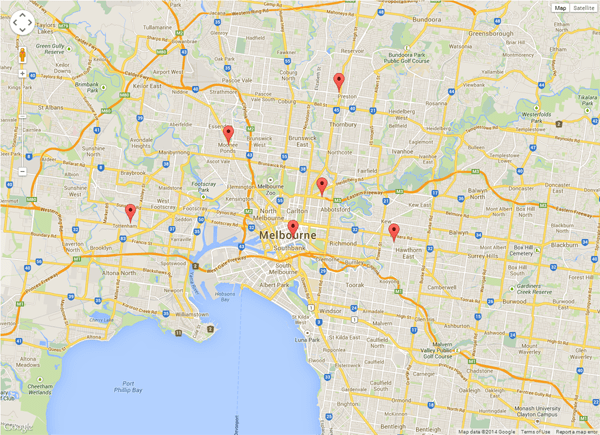
It's simply because our seventh marker is just out of view based on the initial latitude and longitude we set for the map, so we need to refine that center position.
Adjusting the Map Center Position
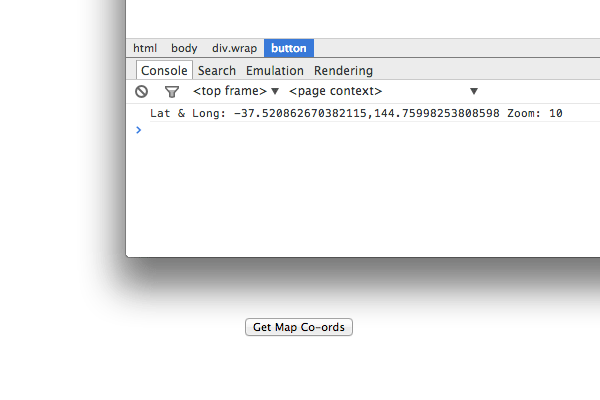
Now that we have all our markers in place we can refine the starting position of the map to ensure they're all visible on load. To do that we'll add a button which we can click to give us new co-ordinates once we find the perfect map starting position.Add this button code to your page, anywhere in the
body section:
1
| <button onclick="console.log( 'Lat & Long: ' + map.getCenter().k + ',' + map.getCenter().A + ' Zoom: ' + map.getZoom() );">Get Map Co-ords</button> |
Update your map's
center option with the new latitude and longitude, as well as the zoom option if that has changed too:
1
2
3
4
| var mapOptions = { center: new google.maps.LatLng(-37.74723337588968,144.961341333252), zoom: 12}; |
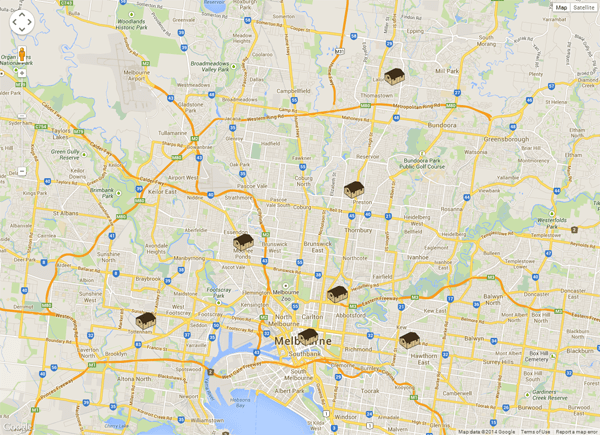
Adding Custom Marker Images
Now that we have all the markers in place and visible for the branch locations we're going to convert them into a custom image, one that goes with the client branding and the style of map. Any image created for use as a map marker should have a transparent background, e.g.locations variable you created previously:
1
| var image = 'images/shoppe_icon.png'; |
icon: image to the for
loop we created earlier to place map markers. Passing this variable
into the map marker generation options specifies that you want the
marker icons to be replaced with your custom image:
1
2
3
4
5
6
7
8
| for (i = 0; i < locations.length; i++) { marker = new google.maps.Marker({ position: new google.maps.LatLng(locations[i][1], locations[i][2]), title: locations[i][0], map: map, icon: image });} |
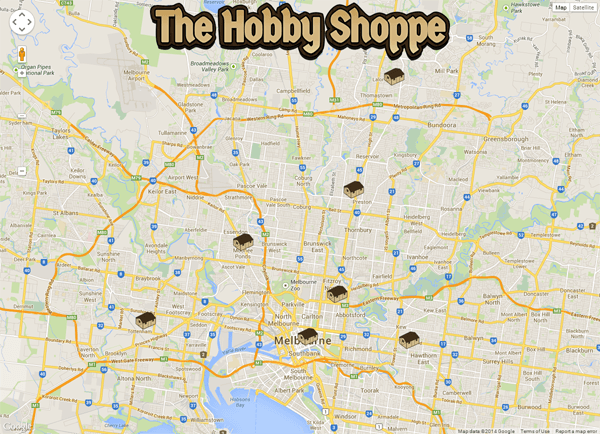
Adding the Client's Logo
We're now going to add the client's logo in such a way that it will remain the same size and in the same position regardless of where the map is zoomed or panned to.The only elements of a Google Map that don't move with panning and zooming are the control UI elements, typically used for things like engaging street view or switching map types. However, we can use the custom control API equally well to place a logo on the screen. We'll also have our new custom control reset the zoom and center position of the map when clicked so as well as displaying the logo it performs a useful UI function.
Start by adding your client's logo image into the same "images" folder you placed your custom marker image. Then add the following JavaScript function just before your existing
initialize() function:
01
02
03
04
05
06
07
08
09
10
11
12
13
14
15
16
17
18
| function LogoControl(controlDiv, map) { controlDiv.style.padding = '5px'; var controlUI = document.createElement('div'); controlUI.style.backgroundImage = 'url(images/logo.png)'; controlUI.style.width = '600px'; controlUI.style.height = '116px'; controlUI.style.cursor = 'pointer'; controlUI.title = 'Click to set the map to Home'; controlDiv.appendChild(controlUI); google.maps.event.addDomListener(controlUI, 'click', function() { map.setCenter(centerPos) map.setZoom(zoomLevel) });} |
Then, at the end of your
initialize() function, insert the following code:
1
2
3
4
5
| var logoControlDiv = document.createElement('div');var logoControl = new LogoControl(logoControlDiv, map);logoControlDiv.index = 1;map.controls[google.maps.ControlPosition.TOP_CENTER].push(logoControlDiv); |
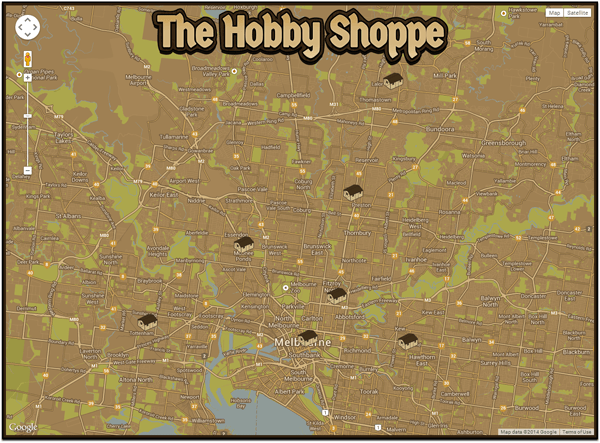
initialize() function runs it will now call the LogoControl() function we just created and add its output into the map controls.Your map should now look like this:
Coloring the Map
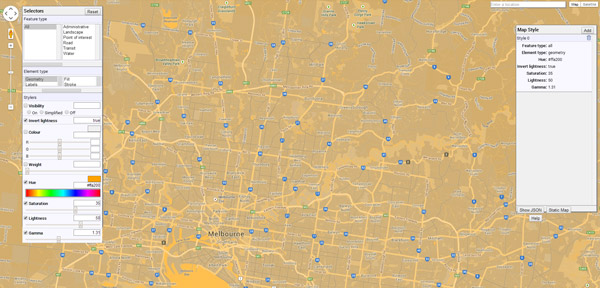
To setup the colors of your map you'll almost certainly want to use Google's Styled Map Wizard in order to get rapid visual feedback on your choices.
With a Feature type selected you can then also make a selection from the Element type menu to determine if you want your color choices to influence the feature's geometry or its labels (such as the little text labels you see floating around the map). Furthermore, you can then also select either the fill or stroke color to modify.
When it comes to choosing colors there are two main areas you'll want to work with; the Colour panel and the Hue panel. The Colour panel will apply a color hexcode flatly to the features and elements you have selected, whereas the Hue panel will tint your selection with a range of lightness and darkness influenced by each element's original color.
As a general rule you should start by applying a Hue to the most general levels of your map so you have some uniformity in your color scheme - you could compare this to a base coat of paint. From there you can then drill down to "paint" over the top with flat Colour settings for more specific features and elements.
Our Map
Start by searching in the wizard for "Melbourne" and then positioning the preview map to show you approximately the same area you set your own map to show.Under the Feature type menu in the wizard select All, and under the Element type menu select Geometry. Then check the Hue box and click the color bar until you get a value of somewhere around
#ffa200.
For some reason you can't directly enter a value in this field, so you
have to get it as close as you can by clicking. Then check the Invert lightness box, activate the Saturation setting and drag it to 35, activate the Lightness setting and place it at 50, and activate the Gamma setting and get it as close as you can to 1.3.These settings should have tinted your entire map like so:
Toning Things Down
Now that you have your first style applied, click the Add button in the top right corner of the Map Style panel, (located at the right side of the map wizard). Clicking this button creates a second style named "Style 1" under which you can select different elements and apply new styles.With "Style 1" selected in the Map Style panel and All still selected under Feature type click the Labels option in the second list of the Element type menu. Check the Hue box and again set it to a value of
#ffa200 so your labels are all tinted instead of being bright blue or green as you see in the image above.Click the Add button on the Map Style panel to create another new style, then click Water in the second list of the Feature type menu. Under the Element type menu select Geometry. Check the Color box and enter a color hexcode of
#8F9B98.The Remaining Styles
You should now know how to create new styles, by selecting Feature type and Element type menu items. Go ahead and add the rest of these styles one at a time in the styled map wizard:- Feature type: All
- Element type: All > Labels > Text > Fill
- Color: #f8ead0
- Feature type: All
- Element type: All > Labels > Text > Stroke
- Color: #6a5035
- Feature type: All > Landscape > Man made
- Element type: All > Geometry
- Color: #9f8053
- Feature type: All > Landscape > Natural
- Element type: All > Geometry
- Color: #9c9743
- Feature type: All > Point of interest
- Element type: All > Geometry
- Color: #ACA74C
- Feature type: All > Road
- Element type: All > Geometry > Fill
- Color: #d3b681
- Feature type: All > Road
- Element type: All > Geometry > Stroke
- Color: #644F34
- Feature type: All > Road > Arterial
- Element type: All > Geometry > Fill
- Color: #c6a15e
- Feature type: All > Road > Local
- Element type: All > Geometry > Fill
- Color: #b09061
- Feature type: All
- Element type: All > Labels > Text > Stroke
- Color: #483521
- Feature type: All > Transit > Line
- Element type: All > Geometry
- Color: #876b48
- Feature type: All > Transit > Station
- Element type: All > Geometry
- Color: #a58557
Exporting Map Styles
Once you've added all these styles you're ready to export the settings the wizard has created and add them into your map. On the Map Style panel click the Show JSON button at the bottom. You'll see a white window appear, displaying an array of JavaScript options.Copy all the text from that window between the opening
[ and closing ], i.e. everything but the main heading.At the beginning of your
initialize() function add this new line:
1
| var styles = ; |
; then paste in the code you copied from the styled map wizard. You should end up with:
01
02
03
04
05
06
07
08
09
10
11
12
13
14
15
16
17
18
19
20
21
22
23
24
25
26
27
28
29
30
31
32
33
34
35
36
37
38
39
40
41
42
43
44
45
46
47
48
49
50
51
52
53
54
55
56
57
58
59
60
61
62
63
64
65
66
67
68
69
70
71
72
73
74
75
76
77
78
79
80
81
82
83
84
85
86
87
| var styles = [ { "elementType": "geometry", "stylers": [ { "hue": "#ffa200" }, { "invert_lightness": true }, { "lightness": 50 }, { "saturation": 35 }, { "gamma": 1.31 } ] },{ "elementType": "labels", "stylers": [ { "hue": "#ffa200" } ] },{ "featureType": "water", "elementType": "geometry", "stylers": [ { "color": "#8F9B98" } ] },{ "elementType": "labels.text.fill", "stylers": [ { "color": "#f8ead0" } ] },{ "elementType": "labels.text.stroke", "stylers": [ { "color": "#6a5035" } ] },{ "featureType": "landscape.natural", "elementType": "geometry", "stylers": [ { "color": "#9c9743" } ] },{ "featureType": "landscape.man_made", "elementType": "geometry", "stylers": [ { "color": "#9f8053" } ] },{ "featureType": "poi", "elementType": "geometry", "stylers": [ { "color": "#ACA74C" } ] },{ "featureType": "road", "elementType": "geometry.fill", "stylers": [ { "color": "#d3b681" } ] },{ "featureType": "road", "elementType": "geometry.stroke", "stylers": [ { "color": "#644F34" } ] },{ "featureType": "road.arterial", "elementType": "geometry.fill", "stylers": [ { "color": "#c6a15e" } ] },{ "featureType": "road.local", "elementType": "geometry.fill", "stylers": [ { "color": "#b09061" } ] },{ "featureType": "transit.line", "elementType": "geometry", "stylers": [ { "color": "#876b48" } ] },{ "featureType": "transit.station", "elementType": "geometry", "stylers": [ { "color": "#a58557" } ] }]; |
initialize() function add these three lines:
1
2
3
| var styledMap = new google.maps.StyledMapType( styles, {name: "Styled Map"} );map.mapTypes.set('map_style', styledMap);map.setMapTypeId('map_style'); |
Wrapping Up
As a final touch you might also like to add a frame effect around your map to further compliment the styling. Replace the existing#map-canvas { ... } CSS in your file with this:
1
2
3
4
5
6
7
| #map-canvas { height: 90%; border: 5px solid #33210f; -moz-box-shadow: 0 3px 3px 3px rgba(0,0,0,0.9), 0 0 0 3px #000; -webkit-box-shadow: 0 3px 3px 3px rgba(0,0,0,0.9), 0 0 0 3px #000; box-shadow: 0 3px 3px 3px rgba(0,0,0,0.9), 0 0 0 3px #000;} |
If you want to take this tutorial even further you could also try adding your own custom styled zoom and pan controls (custom control docs), and creating info windows which pop up when markers are clicked . These popups could hold details like phone number and street address (info windows docs).
Give these techniques a try next time a client asks you to include a Google Map in their site. You might just get a bonus!


