It's
finally happening—you've launched your new business or freelance
venture and finally landed your first client! The project brief is in,
the ideas sounds great, and things are going swimmingly—but what about
getting paid? Whether you've agreed to a fixed price or an hourly rate,
you'll need to formally request payment for your work once your project
is complete, with an invoice. And while the thought of creating invoices
might seem daunting to first-timers, it's actually fairly simple and
you only need a basic desktop or web-based word processor to get
started.
Just as you expect a bill after purchasing an item at
a store, so too does a client expect an invoice detailing the services
rendered after working with you. This document not only enables clients
to pay you, but also helps you keep your accounts in order. Besides,
once you've created your first invoice, you can simply re-use the base
document as a template for all your future projects.
In this
tutorial, I'll show you what an invoice needs, and how to create
professional customized invoices that will impress clients and get your
payments quickly—using just Word or any other word processor you already
have.
What is an invoice, and why do I need one?
An invoice
details services rendered or products delivered by one party to
another, and indicates the payment owed to the supplier. Without it, any
money that exchanges hands between the supplier and the client can't be
accounted for—and accounting for it is important when you need to
determine how much money your business is bringing in, and how much
you'll be taxed. Plus, your clients may have accounting teams that you
may not directly interact with, and they need to know what to pay for,
whom they owe, and how much.
With an invoice, all this information
is readily available, making transactions faster and easier. They're
one of the little necessities of business life.
What does an invoice look like?
Let's
look at a sample invoice—presented by a photography service to a
clothing company for product shots—and understand all the information it
includes: An example invoice.1) Your company identityThis makes it easy to identify your invoice and allows you to present yourself professionally when requesting a payment.
2) Your company's address and contact informationThis lets your client know where to send cheques and correspondence, and where to go for questions and feedback. 3) Invoice title, reference number and invoice dateThe
invoice title indicates which project the client is being billed for,
and makes it easy to differentiate between other invoices received from
your company. The reference number makes the invoice easy to find later
in both the client's and supplier's databases. The date of issue of the
invoice is especially important, as it helps determine when the payment
is expected to be made. 4) Client company name and addressThis lets the client know which branch or office the invoice is addressed to. 5) Payment due dateThis
date is based on the agreement between the supplier and client, and
lets accountants know how soon the payment needs to be scheduled.
Payments are generally requested upon receipt of the invoice, within a
week or within a month, and this field can reflect that. 6) NotesYou
can use this field to briefly describe the project, mention any contact
persons at the client company, or include any terms related to the
project. In this example invoice for a photo shoot, the notes mention
that the digital photo files will be delivered online in various formats
suitable for print and web use. 7) Line itemsThis is
where you can present an itemized breakdown of what you're billing your
client for, and include details like the quantity of deliverable
products, project expenses incurred, billable hours or even milestone
payments for projects with longer timelines. It's important that these
items are descriptive and laid out so they're easy to read (especially
the total due amount), so that your clients have minimal trouble
processing your payment. 8) RemarksThis includes
details on how you'd like to receive payments, as well as information
like your tax registration number. In some jurisdictions, you'll need to
have the number right next to the tax amount, so be sure to check with
your local bureau before designing your invoice. 9) Thank you noteJust
because you're doing business doesn't mean you have to be clinical.
Thank your clients for their business—it only takes a sentence in your
invoice footer!
Simple, isn't it? You can put together this invoice from scratch in just five minutes, or speed things up by using a template.
Creating an invoice with any word processor
Instead
of creating a complete invoice each time, it's far better to build a
template that you can re-use just by changing your client name and
filling out line items. Let's start by creating a new document, and add
in the necessary elements shown in our sample invoice, starting from the
top: A sample invoice in Word.
Supplier company logo and address
Add a two-column, single-row table (Insert > Table > 2x1)
In the left column, add your logo by clicking Insert > Picture or Insert > Image
and importing your logo. If you don't yet have a logo, you can simply
type your company name here using a simple typeface with a large font
size.
In the right column, type in your company name with the
appropriate suffix and then add the address, phone number, website and
email address (optional) below. Select this text and right-align it for a
clean layout.
When you're finished, remove the table borders by right-clicking the table and selecting the No Border option (Microsoft Word), or by reducing the border thickness to 0pt (Google Docs).
Invoice title, reference number and invoice date
Type in these details below the supplier logo and use a large font size for these fields.
Client company and payment due date
Add a two-column, single-row table (Insert > Table > 2x1)
In the left column, type your client's company name and address.
In the right column, type in the payment terms as agreed upon between you and your client.
When you're finished, remove the table borders by right-clicking the table and selecting the No Border option (Microsoft Word), or by reducing the border thickness to 0pt (Google Docs).
Notes
Type these details below the client company name and address, using a medium font size.
Line items
Add a four-column table with multiple rows (you can always delete the extra empty rows later) from the Insert > Table menu option. Add titles for each column: Item, Quantity, Unit Cost, and Total.
If
you bill by the hour, you can change the Quantity and Unit Cost titles
to Hours and Rate. Alternatively, if you have no use for those two
columns, you can remove them by right-clicking and choosing Delete Cells > Delete entire column (Microsoft Word) or choosing Delete column (Google Docs).
Add a light color shade to alternate line items to visually differentiate them, by selecting a row and clicking the Shading button, with a light fill color selected (Microsoft Word), or by right-clicking the selected row, opening Table properties
and choosing a cell background color (Google Docs). For the last few
rows that indicate your sub-total, discount and tax amounts, use a
slightly different shade.
When you're ready to use this
template, fill out each line with billable items and their costs. Make
sure the total payable amount is in a larger font size.
Remarks
Type these details below the line items, using a medium font size.
Thank you note
Choose Insert > Footer, type in your text and then center-align it so it looks neat and clean.
Be
sure to use consistent typography and complimentary, professional
colors in your invoice, so it looks like a continuous document and not a
random arrangement of different elements.
That's it! Save this document as your invoice template, and make
copies of it to create fresh invoices each time, changing the necessary
details (client company name, invoice title, invoice date, invoice
reference number, and payment due date) for your new projects. When your
new invoice is finished, save it as a read-only PDF by choosing File > Save as and selecting PDF in the file type (Microsoft Word) or File > Download as > PDF (Google Docs). All that's left is to attach it to a courteous email to your client.
If you'd like to save yourself some time, you can go ahead and use our free, easy-to-customize invoice templates for Microsoft Word or Google Docs, available in the attachment box on the top right above—just change the necessary details and you're good to go!
What about estimates?
Now
that you've learned to create an invoice, you can just as easily create
an estimate, since it uses the same layout. The only difference is that
an estimate includes the word "Estimate" in the title and may have more
conditions in the Notes section, explaining that the costs included are
indicative and not final.
Advertisement
Creating an invoice using Invoiceable
While
it's easy enough to create an invoice using our guide or our templates,
you can also choose to use a web app for the task—and Invoiceable
is a great free choice that's easy to use and includes a great mix of
features. Sign up, add your company details and logo, add client details
and start creating invoices just by filling out a few fields that are
already laid out for you. The app also allows you to create estimates,
convert estimates into invoices with a single click, track your company
income with simple charts, and maintain a database of client contacts,
download PDFs of your invoices and even send them right from within the
app to your clients.
Invoiceable makes it easy to create, send and manage invoices with layouts ready to be filled.
Conclusion
Incorporating
invoicing into your workflow helps your clients pay you on time, keep
your accounts neat and tidy and keep your accounts, and makes for a
professional way to close the loop when completing a project—and it's
dead simple too, whether you choose to use an app or your own customized
templates. Rather than needing to worrying about finding the perfect
invoicing app, you can just use a customized template through the steps
in this tutorial, using the word processor you already are use.
What are your favorite invoicing tips and hacks? Let us know in the comments below.
When
you need to find and extract a column of data from one table and place
it in another, use the VLOOKUP function. This function works in any
version of Excel in Windows and Mac, and also in Google Sheets. It
allows you to find data in one table using some identifier it has in
common with another table. The two tables can be on different sheets or
even on different workbooks. There is also an HLOOKUP function, which
does the same thing, but with data arranged horizontally, across rows.
The
MATCH and INDEX functions are good to use when you’re concerned with
the location of specific data, such as the column or row that contains a
person’s name.
Screencast
If you want to follow along with this tutorial using your
own Excel file, you can do so. Or if you prefer, download the zip file included
for this tutorial, which contains a sample workbook called vlookup example.xlsx.
Using VLOOKUP
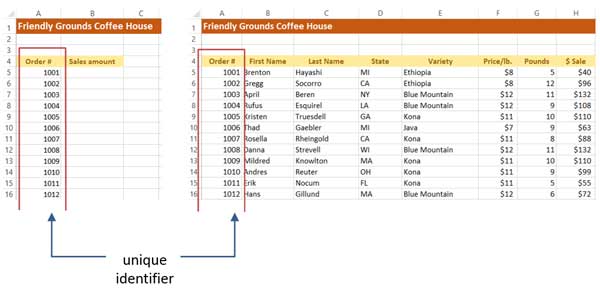
When VLOOKUP finds the identifier that you specify in the source
data, it can then find any cell in that row and return the information to you.
Note that in the source data, the
identifier must be in the first column of the table.
A unique identifier should be like a serial number, where no two are the same in the same table.
Syntax
The syntax of the VLOOKUP function is: =VLOOKUP(lookup value, table range, column number, [true/false])
Here’s what these arguments mean:
Lookup value. The
cell that has the unique identifier.
Table range. The
range of cells that has the identifier in the first column, followed by the
rest of the data in the other columns.
Column number. The
number of the column that has the data you’re looking for. Don’t get that
confused with the column’s letter. In the above illustration, the states are in
column 4.
True/False. This
argument is optional. True means that
an approximate match is acceptable, and False
means that only an exact match is acceptable.
We want to find sales amounts from the table in the
illustration above, so we use these arguments:
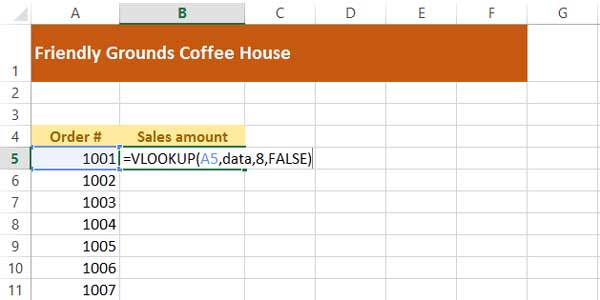
Syntax of the VLOOKUP function
Define a Range Name to Create an Absolute Reference
In Vlookup
example.xlsx, look at the Sales
Amounts worksheet. We’ll enter the formula in B5, then use the AutoFill
feature to copy the formula down the sheet. That means the table range in the
formula has to be an absolute reference. A good way to do that is to define a
name for the table range.
Defining a Range Name in Excel
Before entering the formula, go to the source data worksheet.
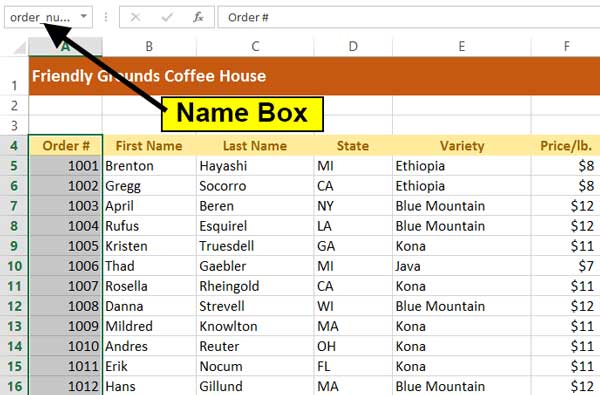
Select all the cells from A4 (header for the Order # column) down through H203. A quick way of doing it is to
click A4, then press Ctrl-Shift-End
(Command-Shift-End on the Mac).
Click inside the Name Box above column A (the Name Box now displays A4).
Type data,
then press Enter.
You can now use the name data in the formula instead of $A$4:$H$203.
The name box usually displays the current cell address. Click inside it and type a name to define a range.
Defining a Range name in Google Sheets
In Google Sheets, defining a name
is a little different.
Click the first column header of your source
data, then press Ctrl-Shift-Right Arrow
(Command-Shift-Right Arrow on the
Mac). That selects the row of column headers.
Press Ctrl-Shift-Down
Arrow (Command-Shift-Down Arrow
on the Mac). That selects the actual data.
Click the Data
menu, then select Named and protected
ranges.
In the Name and protected ranges box on the right, type data, then click Done.
Defining a range name in Google Sheets
Entering the Formula
To enter the formula, go to the Sales
Amounts worksheet and click in B5.
Enter the formula: =VLOOKUP(A5,data,8,FALSE)
Press Enter.
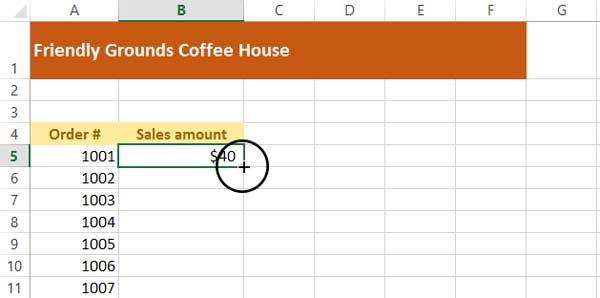
Entering the VLOOKUP functionThe result should be 40. To fill in the values down the column, click back on B5, if necessary. Put the mouse pointer on the AutoFill dot in the
cell’s lower-right corner, so the mouse pointer becomes a cross hair.
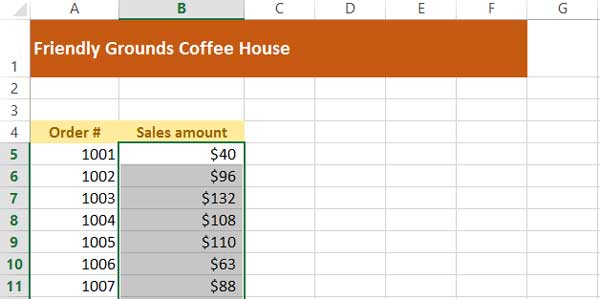
When you place the mouse pointer on the dot in the lower-right corner of a cell, it becomes an AutoFill cross hairDouble-click to fill the values
down the column.
Double-click the AutoFill cross hair to copy the formula down the columnIf you want, you can run the
VLOOKUP function in the next few columns to extract other fields, like last
name or state.
Using MATCH
The MATCH function is doesn’t
return the value of data to you; you provide the value that you’re looking for,
and the function returns the position of that value. It’s like asking where is
#135 Main Street, and getting the answer that it’s the 4th building down
the street.
Syntax
The syntax of the MATCH function is: =MATCH(lookup value, table range, [match type])
The arguments are:
Lookup value. The
cell that has the unique identifier.
Table range. The
range of cells you’re searching.
Match type. Optional.
It’s how you specify how close of a match you want, as follows:
Next highest value
-1
Values must be in descending
order.
Target value
0
Values can be in any order.
Next lowest value
1
Default type. Values must be in ascending
order.
As with the VLOOKUP function, you’ll
probably find the MATCH function easier to use if you apply a range name. Go to
the Source Data sheet, select from B4 (column header for order #) to the
bottom, click in the Name box above
column A, and call it order_number.
Note that the values are in ascending order.
A named range can be just one column, just one row, or even just one cellGo to the Match tab of the worksheet. In B5,
enter the MATCH function: =MATCH(A5,order_number,1)
Entering the MATCH functionIf you didn’t define a range name, you’d write the function
as: =MATCH(A5,'Source
Data'!A5:A203,0)
Either way, you can see that this is in the 14th position (making it the 13th
order).
Result of the MATCH function
Using INDEX
The INDEX function is the opposite
of the MATCH function and is similar to VLOOKUP. You tell the function what row
and column of the data you want, and it tells you the value of what’s in the
cell.
Advertisement
Syntax
The syntax of the INDEX function is: =INDEX(data range, row number, [column number])
The arguments are:
Data range. Just like the other two functions, this is the table of
data.
Row number. The row number of the data, which is not necessarily
the row of the worksheet. If the table range starts on row 10 of the sheet,
then that’s row #1.
Column number. The column number of the data range. If the range
starts on column E, that’s column #1.
Excel’s documentation will tell
you that the column number argument
is optional, but the row number is sort of optional, too. If the table range
has only one row or one column, you don’t have to use the other argument.
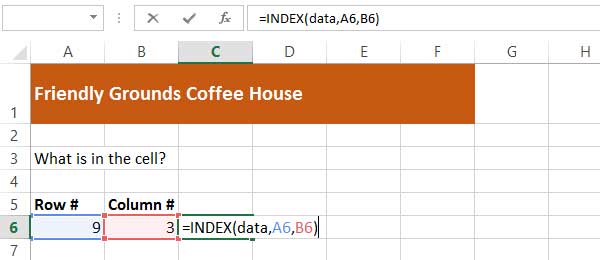
Go to the Index sheet of the workbook and click in C6. We first want to find what’s contained in row 9, column 3 of
the table. In the formula, we’ll use the range name that we created earlier.
Enter the formula: =INDEX(data,A6,B6)
entering the index functionIt returns a customer’s last name:
Strevell. Change the values of A6 and B6, and the result in C6 will show
different results (note that many rows have the same states and product names).
Conclusion
The
ability of a worksheet to look at another worksheet and extract data is a great
tool. This way, you can have one sheet that contains all the data you need for
many purposes, then extract what you need for specific instances.
You
already know how to add animations to objects in PowerPoint, but what
if you want more control over the individual animation timing and
arrangement? That's where the Animation Pane and Advanced Timeline in
PowerPoint come in. These are especially useful tools when you have a
lot of objects moving around and you want
to sync their timing.
The Animation Pane lists of the objects on a slide that
have animation applied. You can use it to reorder the animation sequence and
choose options for the animations. When objects have different durations and
get triggered automatically, their bars on the timeline indicate it with
different lengths. The timeline vaguely resembles what you might see in a
multimedia program like Adobe Flash, though it isn’t as extensive—but then, it doesn't need to be for what PowerPoint does.
In this tutorial, I'll show you how you can use the Animation Pane in PowerPoint to apply entrance, emphasis and
exit effects to text, tables, shapes, images, video clips and any other objects
on a slide that you can select.
Screencast
You
can follow along with this tutorial using your own PowerPoint
presentation if you'd like. Or if you prefer, download the zip file
included for this tutorial, which contains a sample presentation called timeline.pptx.
The presentation has 4 slides and no animations or
transitions applied. Play the presentation just to see how it looks. Either
click the Slide Show button on the bottom of the screen (right side in Windows,
left side on the Mac) or use the shortcut: F5 (Windows) or Ctrl-F5 (Mac). Then
just click through or press Enter to go through the slides.
Three Stages of Animation
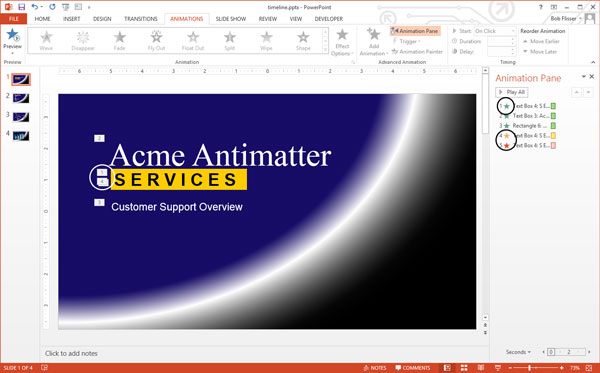
After you finish the slide show, go to slide 1. There are
three items to animate: company name, text in the yellow box, and subtitle
below the yellow box.
There are 3 available times of an object’s animation.
Entrance:
how the object first appears
Emphasis:
what the object does once it’s on the slide
Exit:
how the object leaves the slide
These timings can be exclusive, if you want. For example,
you can have an object that has an animated exit, but not an animated entrance.
Applying Entrance Animation
Let’s apply entrance effects to all three objects. Click
inside the company name (Acme Antimatter) and click the Animations tab on the ribbon. Apply animation in one of three ways,
as you can see in the screen capture, below:
Select an effect in the Animation section or
click the More button and select an
effect
Click the Add
Animation drop-down and select an animation
Click the Add
Animation drop-down, then click More
Entrance Effects, then choose one from the dialog box
Three ways of applying animation to an objectNotice the small “1” in the box next to it. Now apply entrance
effects to the other two objects the same way. The slide should now show a “2”
and a “3”, so it looks like this: Numbers attached to objects indicate the order of animation
Re-Ordering Animation in Windows
Since the yellow box text now comes in second, let’s change
it so it comes in first (the company name will then come in second).
In Windows, click the Animation Pane button on the ribbon.
That will display the pane on the right side, with the three objects listed. Object animation is listed in the Animation PaneEither drag the #2 item to the top, until you see a thin
horizontal bar at the top of the stack, OR select the #2 item and click the Up
Arrow on top of the stack. Re-order animation either by dragging list items in the Animation Pane or by using the Up and Down ArrowsOn the slide, the company name will now show a “2” box and the
yellow box text will show a “1” box. Run the slide again, and that will be the
order they appear.
Re-Ordering Animation on the Mac
The steps are similar on the Mac. Click the Reorder button, and that will display
the floating Custom Animation box, also with the three objects listed. On the Mac, use the Reorder button to change the order of animationEither drag the #2 item to the top (there won’t be any thin
bar to guide you), OR select the #2 item and click the Up Arrow below the stack
of objects.
Now it’s the same as in Windows: on the slide, the company
name will now show a “2” box, and the yellow box text will show a “1” box. Run
the slide again, and that will be the order they appear.
Applying Emphasis and Exit Animation
When you apply additional animation to the same object, the
timeline will display the object more than once. An object will be listed once
for each stage of animation.
Let’s add an emphasis to the yellow box text. Click anywhere
inside it, but if you’re using Windows, don’t just choose an animation from the
main part of the ribbon, or you’ll remove the box’s original animation. We want
to add an effect to the existing one,
so click the Add Animation drop-down
and select an emphasis animation from the list, or choose More Emphasis Effects
and choose one from the drop-down. To add additional animations, click the Add Animation button and choose from the listIf you’re using a Mac, you do select an emphasis effect from the list. Unlike the Windows
version, this will add an animation, and not
override the previous one.
Now use the same method to apply an exit effect.
The result is that the yellow box text has indicators on the
slide and in the timeline showing that it’s #1, 4 and 5 in the sequence. When an object has multiple animations, they're listed in the Animation PanePlay the presentation, and you see it comes in second, does
its emphasis, then exits before the company name and Customer Support text,
since they don’t have any exit effects. So two adjustments to make:
Make the emphasis last longer
Make all three items exit together
In the Animation Pane in the Windows version, put the mouse
pointer on the end of the #4 bar so that the mouse pointer becomes a 2-headed
arrow. Drag to the right, so the bar indicates that it’s now 2 or 3 seconds: Extend the duration of an animation by extending its bar on the timelineIf you’re using a Mac, the Animation Order box doesn’t have
timing bars. To increase the time of this effect, use the Duration box on the right side of the ribbon. (See screen capture,
below.)
Now click inside the Acme Antimatter text, then Shift-click inside the Customer Support
Overview text, so both text boxes become selected. The same way you did before,
add the same exit effect that you chose for the yellow box text.
If you run the presentation now, you’ll see that the yellow
box text still exits first. We want both #6 effects in the timeline to happen
concurrently with the #5 item. In Windows, either right-click it or click the drop-down
arrow and select Start With Previous. You can also choose With Previous from the Start drop down on the ribbon. Making an animation start when the previous event startsIf you’re using a Mac, select both #6 items in the Animation
Order box, click the Start drop-down,
then select With Previous. On the Mac, you can choose With Previous from the Start drop-down on the ribbonNow when you run the presentation, all 3 items will exit
simultaneously.
Controlling the Animation of Text
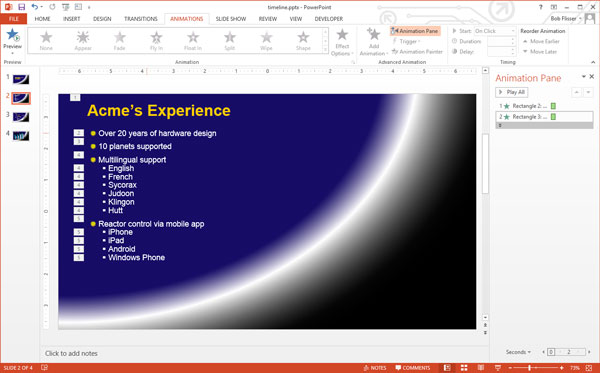
When you have a placeholder of bulleted text, you can
control how much of it comes in at once. Go to slide 2, which has a headline
and bullets on the first and second levels.
As before, select the headline and apply an entrance effect,
then do the same for the box of bulleted text. When you play the slide, you’ll
see that when there are second-level bullets, they enter all at once with the
first-level bullet above them. The numbering shows that will happen: By default, sub-bullets do their animation together with the bullets above themLet’s change that so each line comes in separately. In
Windows, click anywhere in the bullet text, then in the Animation Pane, either right-click
the second item or roll the mouse pointer over it and click the drop-down. From
the drop-down, choose either Effect
Options or Timing. Choose Effect Options or Timing from an object in the Animation Pane to change the sequencing of bulleted textA dialog box appears, and it has three tabs: Effect Options,
Timing, and Text Animation. Click the Text
Animation tab. Click the Group Text drop-down list and select By 2nd Level Paragraphs (or
a higher number). The Text Animation tab has a drop-down for "Group With" that determines how sub-bullets will be animatedClick OK, and you’ll get a preview of the animation running,
with each line of text coming in separately. Run the slide show to get a better
look.
This feature works mostly the same on the Mac. Instead of right-clicking
the item in the Animation Order box, you twirl open the Text Animations section. The choices are the same as in Windows. On the Mac, you control text animation timings using the Text Animation twirl-down section of the Custom Animation dialog
Controlling the Animation of a Chart
Chart animation is similar to text animation. Go to slide 3 of the presentation, which has
a simple column chart. Select the chart, then in the Animations tab of the ribbon, choose an entrance effect. You’ll see
a preview of the animation, which shows the whole chart entering at once. The
chart will be listed as one item in the Animation Pane. Charts get animated just like textYou can make the bars enter in various orders: each group
(year) entering at once, each series (set of 4 columns) entering at once, the
columns of each series entering one at a time, or each column entering one at a
time, from left to right.
In Windows, right-click the Chart 4 item in the Animation Pane, then select either Effect Options or Timing. In the dialog box that appears, click the Chart Animation tab. That tab has only
one thing in it: a drop-down list. Click it and make a choice, then click OK.
Try a few of them to see which one you like.
The Mac version also works like animating text. After
applying the animation, make the adjustments in the Chart Animations twirl-down section of the Custom Animation box or with the Effect Options button on the
ribbon. On the Mac, use the Chart Animations twirl-down section to control the timings of chart pieces
Synchronize Automatic Timings
The Animation Pane is especially helpful when object
animations run automatically, rather than with a mouse click. The main
difference between the Windows and Mac versions is that the Mac doesn’t display
an actual timeline, with horizontal bars. Otherwise, the capabilities of the
Custom Animation dialog box are the same.
Go to slide 4 of the timeline presentation. The horizontal
arrow is one object, and if you click one of the thumbnail images, you’ll see it’s
grouped with the description, arrow and month. We’ll apply animation to the horizontal
arrow, then to each of these groups. In
the included sample file, the month name, description, arrow and
thumbnail of each month's objects are grouped, so they will all get
animated together
Animating the Horizontal Arrow
Select the horizontal arrow, and from the Animations tab,
apply a Wipe transition. Click Effect Options and choose From Left. On the Mac, it’s the same
thing, and you’ll find the Effect Options section as a twirl-down in the Custom
Animation toolbox and also on the ribbon. After applying the Wipe effect to the main arrow, make it wipe from left to rightOn the right side of the ribbon, note the Timing group, which has settings for Start, Duration and Delay
options. For the horizontal bar, leave the default settings, which should be:
Start: On click
Duration: half second
Delay: none
On the Mac, these options are in the Timing twirl-down section of the Custom Animation toolbox.
Preview the slide, if you want.
Advertisement
Animating the Groups of Objects
Select the first group (“Acme Purchases Tablets”). It’s
easiest to select the group by clicking the image thumbnail. On the ribbon, choose
the Wipe effect, and make it wipe upwards, which should be the default
direction. Use these timings:
Start after previous
Duration: half second
Delay: 1 second
This means that 1 second after the horizontal bar finishes,
this group of objects will spend half a second wiping upwards.
A quick way of applying the same settings to the other two
groups of objects that are above the bar is to use the Animation Painter. Leave
the first group selected, then on the ribbon bar, double-click the Animation Painter. Now click the other
two thumbnails above the horizontal bar.
Since you’re done with the Animation Painter for a moment,
you need to exit it. Either press the Esc
key or click the Animation Painter. The mouse pointer will become normal,
again.
If you’re using the Mac, there is no Animation Painter. You
have to apply the animation to the other groups manually, as you just did with
the first group.
Now animate the two groups below the horizontal arrow. Select
the first group, apply the Wipe effect, and have it wipe downwards from the top.
Make sure it uses the same timings as the others:
Start after previous
Duration: half second
Delay: 1 second
In the Windows version, click the Animation Painter (only a
single-click, this time), then click the Stock Fluctuations group. In the Mac
version, manually apply the animation to the other groups.
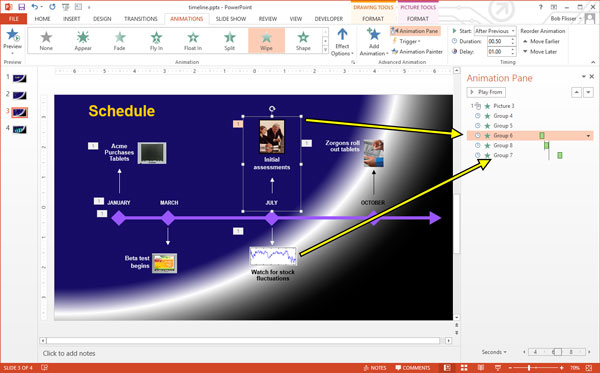
The slide should now look like the screen capture below,
with the timeline showing the progression of the animations. Note there is only
1 mouse icon in the Animation Pane: it shows that we have to click (or press
Enter) just once. That will make the horizontal arrow come in, and everything
else will follow automatically. After applying animation to all the groups, the timeline shows the sequencePreview the slide. It’s almost right, except the group below
July should wipe down simultaneously with the group above July wiping up.
Click the top July item, and notice that it’s Group 6, which
is 4th on the list. The bottom July item is Group 7, which is 6th
(last) on the list. When you select a group, you'll see its position in the Animation PaneBump Group 7 up in the Animation Pane one spot, so it’s just
below Group 6. Set the timings as follows:
Start: with previous
Duration: half second
Delay: 1 second
In the Windows version, that makes the green bars for Groups
6 and 7 run concurrently in the timeline. But now the last group needs to be
delayed for 1 second, so you can either drag its green bar to the right, or
select the group and set the delay to 1 second.
Also notice that below the timeline, there is a scale of
seconds. You can drag the box on this scale left or right to see all the timings. To
change animation timings, either use the Timing controls on the ribbon,
or drag and resize the horizontal bars in the timelinePreview the slide when you’re done.
Conclusion
PowerPoint’s Animation Pane and timeline are great features
that give you detailed control over object animations. Remember that to use it,
you apply an animation first, then choose an option in the Animation Pane or
toolbox on the Mac. And don’t forget that some of the most important features
are in the third tab of a pop-up dialog box from a right-click menu.
Medical Disclaimer
The information on this site is not intended or implied to be a substitute for professional medical advice, diagnosis or treatment. All content, including text, graphics, images and information, contained on or available through this web site is for general information purposes only. Krobknea makes no representation and assumes no responsibility for the accuracy of information contained on or available through this web site, and such information is subject to change without notice. You are encouraged to confirm any information obtained from or through this web site with other sources, and review all information regarding any medical condition or treatment with your physician. NEVER DISREGARD PROFESSIONAL MEDICAL ADVICE OR DELAY SEEKING MEDICAL TREATMENT BECAUSE OF SOMETHING YOU HAVE READ ON OR ACCESSED THROUGH THIS WEB SITE.